Extraction of gully erosion-affected areas by image analysis of high spatial resolution satellite data
Description
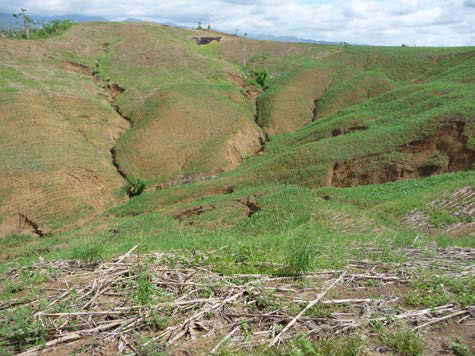
Gully erosion is a natural phenomenon that occurs during and after severe rainfall leading to the loss of topsoil, the formation of ditch-like features on sloping areas, and the deterioration of productive agricultural lands. Over the past decade, gully erosion has developed significantly on hilly areas along Cagayan River in the northern part of Luzon Island in the Philippines. Photo 1 shows the natural landscape at the site on November 23, 2010. In order to grasp the actual condition and spatial distribution of gullies in this area, the author attempted to develop a method to extract gully information using high spatial resolution satellite data.
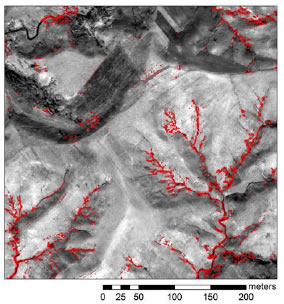
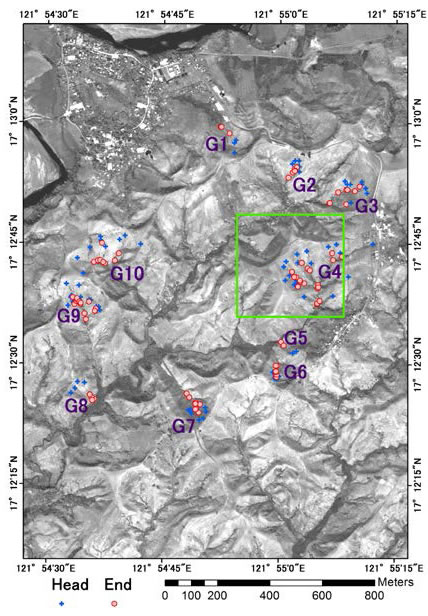
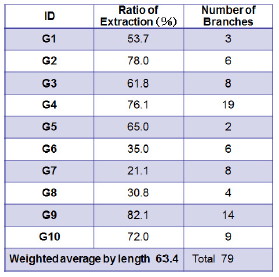
Gully-eroded areas are presented as dark linear features on satellite images on the condition that the spatial resolution of satellite data is small enough. According to the survey report by the Philippine Bureau of Soil and Water Management (BSWM), the average gully top width was about 2 meters, which was considerably larger compared with the 0.5 meter spatial resolution of the WorldView panchromatic data adopted in this study. After performing median filtering to reduce local noise, the Sobel filter was applied to enhance the edge features of the images. Enhanced linear parts were contaminated with gully and non-gully objects, and the following processes were undertaken to extract only the gully-affected areas: First, the topographic factors were considered by enhancing the image contrast of the pixels oriented orthogonally to the slope orientation. Second, texture parameters (window size: 21 by 21 pixels) were calculated and non-gully objects were discriminated after setting an appropriate threshold. This method was effective in masking out non-gully parts such as roads, houses, piles of crop residue, irregular ground conditions on arable land, and so on. Third, forest areas (another mask data) were estimated from multi-temporal ALOS/AVNIR2 data, which has a 10-m spatial resolution. Figure 1 shows extracted gully-affected areas overlaid on WorldView imagery for a part of the study site. To verify the results, the author compared it with the gullies surveyed by the BSWM. Figure 2 shows the heads and ends of the surveyed gullies. Because the survey data indicated only the location of gullies including branches and did not indicate continuous features, the agreement between extracted and surveyed gullies was ranked into 4 levels by manual interpretation and then assigned quantitative values. Table 1 shows the average ratio of properly extracted gullies weighted by length and it concludes that 63.4 percent of gullies were properly extracted.
The method mentioned above can be applied to any region in the world if high spatial resolution satellite data (taken in the period when ground is barely covered) can be obtained. This can realize rapid mapping of gully erosion-affected areas seamlessly over wide areas and without conducting field surveys. It is also advantageous that the output data are readily available in georeferenced digital format and are of homogeneous quality, thus facilitating spatial analysis operations for the characterization of existing gullies. Adjustment of parameters, however, may be necessary to discriminate gully and non-gully features in accordance with image conditions.
Figure, table
-
Photo 1. Gully erosion appears at the study site near Ilagan City, Isabela Province, Philippines(taken on November 23, 2010)
-
Fig. 1. Image overlay showing the gully erosion-affected areas (in red) extracted from satellite imagery
-
Fig. 2. Location map of gullies surveyed by BSWM (Green rectangle indicates spatial range shown in Fig. 1)
-
Table 1. Agreement (Ratio of extraction) between the extracted gully erosion features and the surveyed gullies (data by BSWM)
- Affiliation
-
Japan International Research Center for Agricultural Sciences Social Sciences Division
- Classification
-
Administration B
- Program name
- Term of research
-
FY 2014 (FY 2011-FY 2014)
- Responsible researcher
-
Uchida Satoshi
Nagumo Fujio ( Crop, Livestock and Environment Division )
KAKEN Researcher No.: 20399372 - ほか
- Publication, etc.
-
https://doi.org/10.14962/jass.31.1_11
Uchida and Nagumo (2015), Journal of the Japanese Agricultural Systems Society, 31(1) :11-20
- Japanese PDF
-
2014_A06_A3_ja.pdf345.02 KB
2014_A06_A4_ja.pdf734.7 KB
- English PDF
-
2014_A06_A3_en.pdf287.25 KB
2014_A06_A4_en.pdf349.31 KB
- Poster PDF
-
2014_A06_poster.pdf718.97 KB


