Development of a new method to produce cloud-free land use data for tropical humid climate regions using multi-temporal satellite data
Description
Land use is a basic information that is used to characterize agricultural activities for the site of interest. Land use data which discriminated the major agricultural land use types such as paddy, upland, and so on were provided, for example, by interpretation of aerial photos in combination with ground surveys.
In the case of developing regions, however, land use data could not be produced owing to the lack of appropriate coverage by aerial photos as well as the difficulty of ground surveys. Therefore, satellite data which could be used to observe repeatedly the ground surface conditions for any selected area were expected as a promising tool to overcome this deficit.
A number of attempts were performed to produce land use data using satellite data, but these were not able to obtain satisfactory results especially for the areas located in the tropical humid climate region, due to the major constraints of 1) high probability of being usually covered with clouds, and 2) existence of complex cropping patterns in terms of planting time. In this study, we aimed at the development of a method of producing cloud-free land use data with a pixel size of 30 meters for the area located in the tropical humid climate region using multi-temporal Landsat data. The study site was selected in a western part of Java Island, Indonesia.
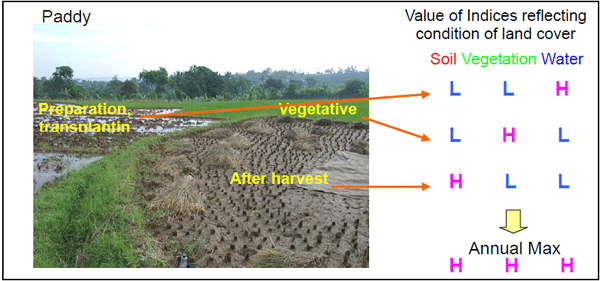
This method applied a concept that each land use type shows specific changing patterns of ground surface conditions within a year. For example, a paddy field may exhibit a cover type of either water, vegetation or bare soil at different instances, but the annual maximum conditions would be uniform as shown in Figure 1 (in case of Paddy). We employed five indices, of which two were represented as the conditions of coverage by soil, one by vegetation, and two by water, calculated from Landsat-TM or ETM+ data.
The probability of obtaining a cloud-free scenery was very low as only about once a year on average, so that the data employed here were taken within a period from 1994 to 2003. After conversion to reflectance values and performing geometric correction of all the scenes, we firstly removed the cloud-affected areas from each scene, and then calculated the maximum value of each index at every pixel. Five parameters composed of the maximum values of five indices could be used to characterize the annual pattern of changes of ground surface conditions.
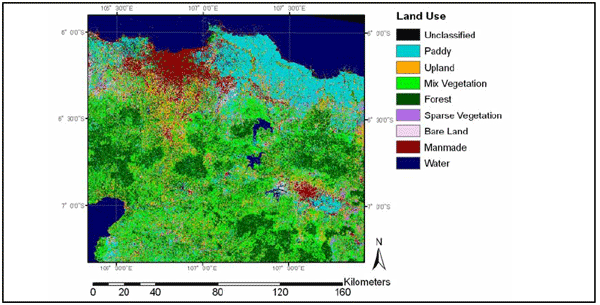
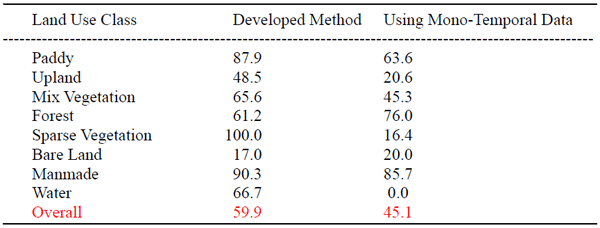
Figure 2 shows the result of the discrimination of land use type using the developed method. It depicts a map consisting of 30 meter-sized pixels with complete removal of the effect of cloud cover over the site. The accuracy of the discrimination of land use was examined by means of comparison with the interpreted result of very high resolution spatial satellite data (QuickBird). Table 1 shows the percentage of correctly discriminated land use class in the case of the results obtained by this method in the left column and the case of classification using mono-temporal Landsat data as typical conventional method in the previous study in the right column. This table concluded that substantial improvement especially for agricultural land use was attained in terms of the accuracy of data discrimination as provided by the method developed in this study.
The developed method would be applicable to various instances of producing land use data for the area where details and reliable information are insufficient. The spatial resolution of the output data should first be harmonized with recently published global digital elevation data. Then, it can be used for the evaluation of location of different land uses in association with agro-environmental problems. We should be aware, however, that although this method could adequately discriminate significant types of agricultural land uses, it can only discriminate rather poorly other land use types, because it could not fully employ the spectral variations of the original satellite data in the process of discrimination.
Figure, table
-
Fig.1. Simultaneous land cover conditions and annual maximum values of indices reflecting the conditions of land cover in case of paddy areas. -
Fig.2. Produced land use map of the study site in the western part of Java Island, Indonesia. -
Table 1. Comparison of percentages of correctly discriminated land use classes between developed method and classification using mono-temporal data.
-
- Affiliation
-
Development Research Division
- Classification
-
Administration B
- Term of research
-
FY2009(FY2006~2010)
- Responsible researcher
-
UCHIDA Satoshi ( Development Research Division )
SHOFIYATI Rizatus ( Indonesian Center for Agricultural Land Resources Research and Development )
- ほか
- Publication, etc.
-
UCHIDA Satoshi (2009) Journal of the Japan Society of Photogrammetry 48(6):348-356
Uchida et al. edited (2009) Proc. ICALRD-JIRCAS Workshop: ISBN 978-602-8039-18-5
- Japanese PDF


