Estimation of nitrogen load to groundwater at a sugarcane monocropping area in the Philippines
Description
The Philippines is one of the major sugarcane-producing countries in Southeast Asia. In particular, a typical sugarcane monocropping area in Negros Island accounts for about 60% of cultivated land throughout the country. The soil in the area consists of a limestone layer with high water permeability, and although groundwater is an important water resource, the nitrogen that is added to the ground surface promptly permeates underground and contaminates groundwater. Therefore, we investigated the actual condition of nitrate nitrogen (NO3-N) concentration in groundwater. Also, using the annual nitrogen emission data, we calculated the total input amount from various nitrogen inputs in the northern part of the island, which is a typical sugarcane-growing area, and estimated the contribution rate of each input. Lastly, we estimated the nitrogen balance and the potential nitrogen load to the ground due to nitrogen input to the ground surface.
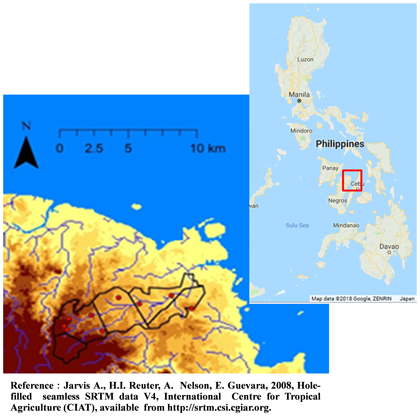
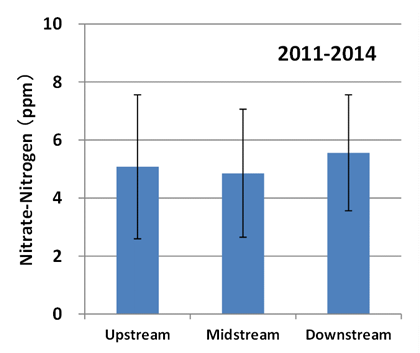
A comparatively high concentration of NO3-N (i.e., 5.6 ppm average, 8.7 ppm maximum) was detected from shallow groundwater (about 5 to 6 m from ground surface) at nine points in the research area (Fig. 1), indicating that the risk of nitrogen contamination is high (Fig. 2).
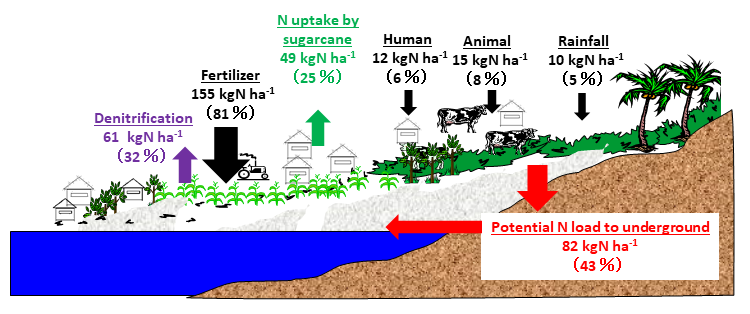
The sugarcane cultivation area constitutes 77% of land use. The fertilization area, number of livestock, population, and sugarcane cultivation area (Table 1) were assigned to each of the basic units (amount of nitrogen contained per unit amount) of fertilizer, livestock excreta, human excreta, and rainfall (which becomes nitrogen input to the ground surface) to obtain the total nitrogen input amount to the ground surface. The estimated total nitrogen input amount was 192 kgN ha-1 (155, 15, 12, 10 kgN ha-1, respectively), of which 81% is nitrogen fertilizer applied in sugarcane cultivation (Fig. 3). Assuming that nitrogen loss through denitrification was 32% among nitrogen inputs to the ground surface (Yoshimoto et al., 2007), its amount was calculated to be 61 kgN ha-1. In addition, from the measurement result of nitrogen absorption amount of stem and leaf, the nitrogen absorbed by sugarcane, and eventually taken out of the system as stem or leaf as harvest product, was 30 kgN ha-1 in the case of stem alone and 49 kgN ha-1 including leaf, which is equivalent to only 25% of the total nitrogen input amount. Based on these results and according to nitrogen balance estimation in this area, the potential nitrogen load to the underground including surface runoff is lower than that of the nitrogen input to the ground surface when only the sugarcane stem is taken out, and 43% when taking out both stems and leaves of sugarcane (Fig. 3). In the sugarcane cultivation area, the contribution to the underground nitrogen load by fertilizer-derived nitrogen contributes greatly to the NO3-N contamination of the groundwater. The safe upper limit set by the World Health Organization (WHO) for NO3-N concentration in drinking water is 10 ppm. A maximum of 8.7 ppm of NO3-N concentration in the groundwater in the area was detected, thus the amount of nitrogen load to underground should be reduced. It will serve as basic data that can be applied when considering steps to reduce the nitrogen load on the ground surface and underground in this area.
Figure, table
-
Fig. 1. Research area(Sagay City, Northern Negros Island)
-
Fig. 2. Nitrate-nitrogen content in shallow groundwater (Error bars indicate standard deviation)
-
Table 1. Overview of the research area
Area of watershed(ha)Area of sugarcane cultivation(ha)Human PopulationAnimal PopulationAmount of rainfall(mm/year)3,4222,6296,5776,6071,985 -
Fig. 3. Estimated nitrogen balance using nitrogen load to ground surface in the research area
- Affiliation
-
Japan International Research Center for Agricultural Sciences Tropical Agriculture Research Front
- Research project
- Program name
- Term of research
-
FY2017(2011~2020)
- Responsible researcher
-
Goto Shinkichi ( Tropical Agriculture Research Front )
Ando Shotaro ( Tropical Agriculture Research Front )
Anzai Toshihiko ( Rural Development Division )
- ほか
- Publication, etc.
-
https://doi.org/10.14962/jass.33.2_57
Goto, et al. (2017) Journal of the Japanese Agricultural Systems Society 33(2): 57-63
- Japanese PDF
-
A4748.56 KB
A3791.6 KB
- English PDF
-
A4 295.36 KB
A3289.55 KB
- Poster PDF
-
2017_A02_poster.pdf772.36 KB


