Variable-timing, fixed-rate application of cattle biogas effluent as fertilizer for rice using a leaf color chart
Description
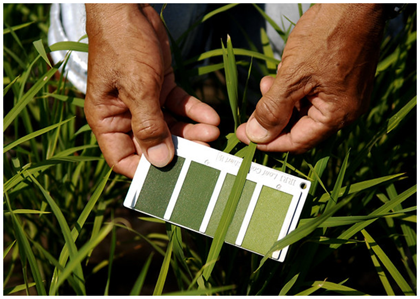
Small-scale biogas production from farmyard manure for domestic usage is popular in Vietnam. However, there are cases when untreated effluents from biogas digesters (i.e., anaerobic digestion effluents), including plant nutrients such as nitrogen (N), are discharged to river systems, causing environmental problems such as water pollution. To solve it, we proposed using the biogas effluent as fertilizer for rice, the major local crop. In practice, farmers need to know N concentration in the effluent to determine the application amount and timing. Although the application amount can be roughly estimated using a test paper for N concentration, the application timing plays the main role in adjusting the deficiency and excess of the estimated amount. Here we examined the performance of variable-timing, fixed-rate application of biogas effluent from cattle manure for rice production (cultivar: OM5451) using a leaf color chart (LCC) that was developed by the International Rice Research Institute (IRRI, Fig. 1). Two microcosm experiments were carried out at a plastic film house in Can Tho, Vietnam, in different seasons in 2018.
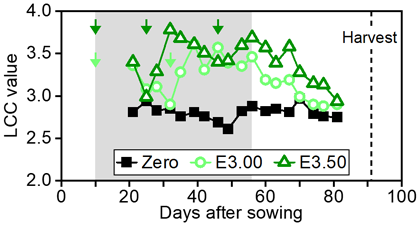
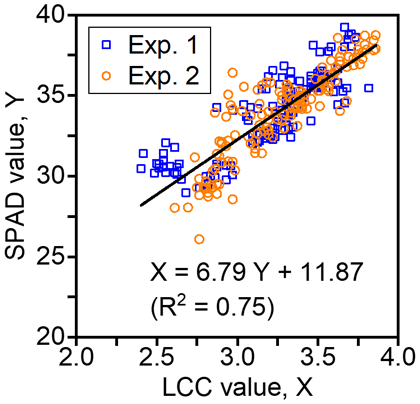
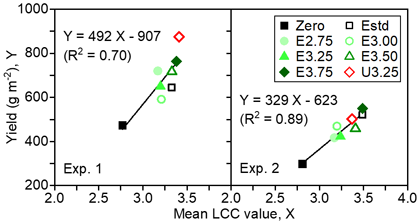
We set several LCC threshold values (Table 1), below which we applied a fixed amount of the effluent as illustrated in Figure 2. By each incremental raising of the LCC threshold, the application timing and the resultant total amount were increased (Table 1). There was a positive linear relationship between LCC values and Soil Plant Analysis Development (SPAD) values, an indicator of leaf chlorophyll content, regardless of the seasons (Fig. 3). This relationship indicates that a cheap LCC can substitute for an expensive SPAD meter to estimate leaf color even in the case of using effluent as fertilizer. Rice grain yield and straw biomass were also increased by raising the LCC threshold, suggesting that determining the application timing based on LCC threshold is feasible under microcosm conditions. There were positive linear relationships between the mean LCC values during 21 to 81 days after sowing and the grain yields in both seasons (Fig. 4). The optimum LCC threshold for effluent application was 3.75 under microcosm conditions.
The proposed method can achieve yield levels comparable to those from inorganic fertilizers. However, when determining the application amount based on N concentration in the effluent, the application amounts of phosphorus (P) and potassium (K) from the effluent may become deficient or excessive due to the imbalance of NPK concentrations. The optimum LCC threshold in terms of rice grain yield may change depending on the cultivar and environment, therefore farmers need to determine it independently. Because the use of effluent as fertilizer requires additional labor and cost compared to that of inorganic fertilizers, financial administrative support is essential in order to mitigate the environmental problems.
Figure, table
-
Table 1. The method and the total rate (kg N ha-1) of N application for eight treatments in two experiments
Treatment Application method Experiment 1 Experiment 2 Zero No nitrogen 0 0 Estd Split-application, for three times at conventional timings 150 (30-50-70) 150 (30-50-70) E2.75 60 kg N ha-1 as effluent whenever LCC value goes below 2.75 90 (30-60) 90 (30-60) E3.00 60 kg N ha-1 as effluent whenever LCC value goes below 3.00 90 (30-60) 90 (30-60) E3.25 60 kg N ha-1 as effluent whenever LCC value goes below 3.25 90 (30-60) 90 (30-60) E3.50 60 kg N ha-1 as effluent whenever LCC value goes below 3.50 150 (30-60-60) 150 (30-60-60) E3.75 60 kg N ha-1 as effluent whenever LCC value goes below 3.75 150 (30-60-60) 210 (30-60-60-60) U3.25 60 kg N ha-1 as urea whenever LCC value goes below 3.25 150 (30-60-60) 90 (30-60) Experiment 1 mainly in dry season and Experiment 2 mainly in wet season.
he first N application was conducted 10 or 11 days after sowing at 30 kg N ha-1, except for Zero treatment.
P and K (only in Zero and U3.25 treatments) were split-applied as inorganic fertilizers at conventional timings. -
Fig. 1. Measuring the LCC value
(Photo courtesy: Mr. Ariel Javellana, IRRI) -
Fig. 2. An example of seasonal shifts in LCC values in Experiment 2
Arrows indicate the timings of N application in respective treatments. Grey shade indicates the target period for N application. -
Fig. 3. Relationship between LCC values and SPAD values in two experiments
-
Fig. 4. Relationships between the mean LCC values and rice grain yields in two experiments
Yield is expressed as 14% moisture content.
- Affiliation
-
Japan International Research Center for Agricultural Sciences Crop, Livestock and Environment Division
- Classification
-
Technical A
- Research project
- Program name
- Term of research
-
FY2019 (FY2016-FY2020)
- Responsible researcher
-
Minamikawa Kazunori ( Crop, Livestock and Environment Division )
Hosen Yasukazu ( Institute for Agro-Environmental Sciences, NARO )
KAKEN Researcher No.: 90353549Huynh Cong Khanh ( Can Tho University )
Tran Sy Nam ( Can Tho University )
Nguyen Huu Chiem ( Can Tho University )
- ほか
- Publication, etc.
-
https://doi.org/10.1080/00380768.2019.1665970
Minamikawa K et al. (2020) Soil Science and Plant Nutrition, 66(1):225-234
- Japanese PDF
-
A4555.47 KB
A3224.29 KB
- English PDF
-
A4134.05 KB
A3201.66 KB
- Poster PDF
-
2019_A01_poster_fin.pdf289.41 KB


