Production and trade of major crops in Myanmar
Country
Myanmar
Description
Myanmar has drawn attention as “the last frontier” after shifting to civilian rule and being relieved of economic sanctions in 2011. The agricultural sector is expected to grow rapidly as a result of an increase in investments, which had been very limited. Using official data published by the government of Myanmar, this study generated maps covering 14 administrative regions to grasp the spatial characters of agricultural production.
Maps showing paddy, oil crops (e.g., sesamum, sunflower, ground nut), pulses for food (e.g., green gram, black gram, pigeon pea), and several other crops were created (Table 1). Sown area, yield, and production quantity were displayed in maps subdivided into administrative regions (Fig. 1). In addition to these basic data, also generated were the estimated annual average rate of change of those items, the proportion of sown area in arable land, the contribution of yield change to production change, and the per capita supply of those items. Figure 2 shows a visualized time series data of sown area, yield, production quantity, domestic supply, and trade. Prices (e.g., market price, producer price, and export or import price) deflated by the consumer price index, or the GDP deflator, were juxtaposed in each graph. Graphs depicting domestic supply and trade included self-sufficiency rates, export rates, trade quantities, values, and prices. Trade values and prices in local currency, which were originally associated with “official exchange rate,” were revised with “parallel market exchange rate.” Furthermore, domestic market prices were added to the graphs of export or import price to show the gap between prices within and outside Myanmar.
The results of this study have been published by the Research Strategy Office and uploaded to JIRCAS’s Program D webpage. Although the report is written in English, some contents and descriptions are also written in Japanese. The spatial and temporal characteristics of agriculture in Myanmar can be grasped easily; for example, production quantities and deflated prices, such as market price, producer price, and export or import price, will help estimate the relationship between prices and supply responses. There are issues of reliability in the raw data; nevertheless, this report would be useful for gaining a rough perspective on the agricultural situation and could provide materials for further discussion. An update will be considered in 2016.
Figure, table
-
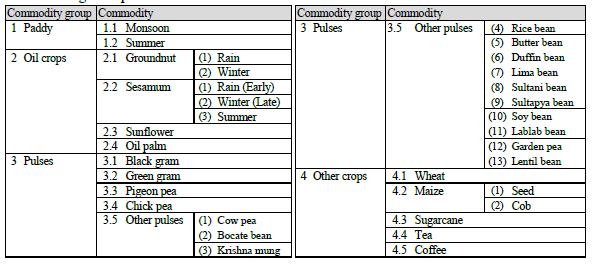
Table 1. Target crops
-
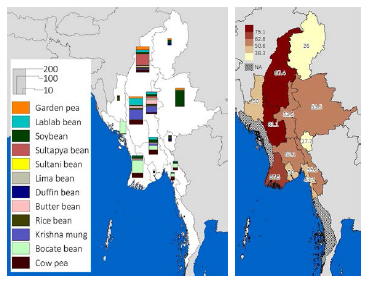
Fig. 1. Thematic maps
Left: Sown area of beans for food in 2010 (1,000ha). Right: Contribution of the yield change in sesamum production during 2000–2009 (%) -
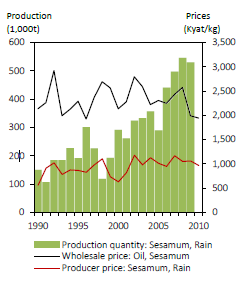
Fig. 2. Production quantity and prices (deflated to 2010 level). 1 kyat ≈ 0.001USD in 2010
- Affiliation
-
Japan International Research Center for Agricultural Sciences Research Strategy Office
- Classification
-
Research
- Program name
- Term of research
-
FY 2014 (FY 2011-FY 2015)
- Responsible researcher
-
Kusano Eiichi ( Social Sciences Division )
Koyama Osamu ( Research Strategy Office )
- ほか
- Publication, etc.
-
Research Strategy Office (2014) Production and trade of major crops in Myanmar , Statistical Information, Research Strategy Office, JIRCAS, pp.109.
- Japanese PDF
-
2014_D01_A3_ja.pdf249.17 KB
2014_D01_A4_ja.pdf348.3 KB
- English PDF
-
2014_D01_A3_en.pdf120.85 KB
2014_D01_A4_en.pdf157.89 KB
- Poster PDF
-
2014_D01_poster.pdf350.67 KB