Rice and weeds in upland rice fields can be discriminated with good accuracy from a commercial-grade small drone
Country
Laos
Description
Weed control is an important task to improve the productivity of upland rice, which is a major crop in Laos. Aerial images of fields taken with drones are effective tools for early detection of weeds and rapid herbicide treatment, but there is no practical method that can be used in farm fields. Therefore, based on object-based image analysis (OBIA), this study developed a method for discriminating rice and weeds using RGB (Red-Green-Blue) color images of upland rice fields in Laos taken with a commercial-grade small drone.
The experimental results are summarized as follows.
- In an experimental field (furrow 25 cm × 25 cm), a small drone (DJI Phantom 4) was used to capture RGB images at a flight altitude of 20 m (ground resolution 1 cm) 29 days after sowing. HSV (Hue-Saturation-Brightness) and Texture (spatial variance) were calculated from the RGB color image. As training data, the positions of rice, weeds, and soil on the image were collected from the RGB color image by visual interpretation. In OBIA, (1) the images were segmented by similar pixel values using the SLIC (Simple Linear Iterative Clustering) method, (2) statistics were extracted from the segments of classification class (rice, weeds, and soil) in the training data, and (3) the extracted statistical values were used as explanatory variables for random forest classifier.
- OBIA classified rice and weeds, mainly Asteraceae and Legumes, which dominated the upland rice fields in Laos, with overall accuracy (OA) of 90% or more (Table 1), and provided the spatial distributions (Fig. 2).
- Soil was classified with a recall value of 99.0% even if only the HSV color information was used, but the accuracies of rice and weeds classification could be improved by adding Texture information (Table 1).
- Since the coverage of rice, weeds, and soil classified from the drone changed between 1, 17, and 34 days after weeding (Fig. 3), it is possible to quantitatively grasp the situation in which weeds grow over time after weeding treatment.
Rice and weeds could be rapidly discriminated with practical accuracy by OBIA with a small drone. Farmers can grasp the weed growth in the field at an early stage and use it as basic information for appropriate weed management (herbicide treatment). If this method is applied to field phenotyping, the influence of weeds can be removed from the image without weed removal in the field, and improvement of the accuracy and efficiency for rice growth monitoring can be expected. It should be noted that is possible to fly at a higher altitude to shoot a wider area in a short time, but the classification accuracy will decrease accordingly, so it is necessary to formulate a flight plan that suits the purpose of use. In addition, the classification accuracy may decrease for weed species with similar morphology, such as grass weeds.
Figure, table
-
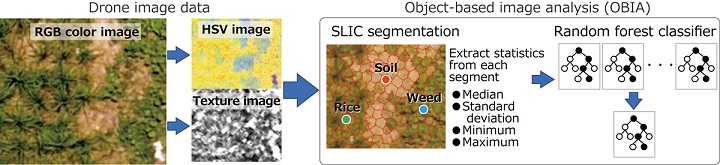
Fig. 1. Processing flow of object-based image analysis using HSV image and Texture image (spatial variance) calculated from RGB color image of drone
Extracted statistics from the segments created by the SLIC (Simple Linear Iterative Clustering) method are used as input values for random forest classifier.
-
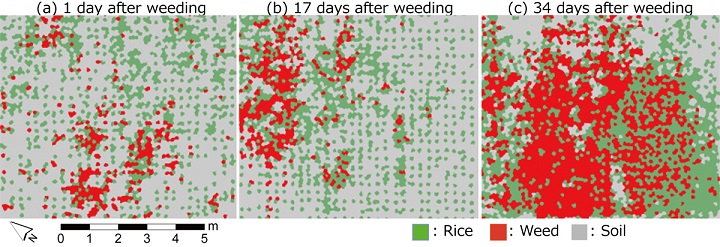
Fig. 2. Spatial distribution map of rice, weed, and soil classified by object-based image analysis of drone images
Comparison of treatment plots with different days after weeding (1, 17, and 34 days after weeding)
-
Table 1. Confusion matrix in random forest classification
Classified as Rice Weed Soil Recall (a) HSV (OA = 0.901, F-score = 0.900) True class Rice 82 18 0 0.820 Weed 11 89 0 0.890 Soil 1 0 99 0.990 Precision 0.872 0.832 1.000 (b) HSV + Texture (OA = 0.910, F-score = 0.906) True class Rice 83 17 0 0.830 Weed 9 91 0 0.910 Soil 1 0 99 0.990 Precision 0.892 0.843 1.000 OA: overall accuracy
-
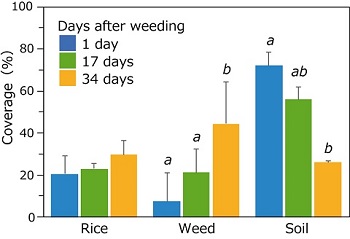
Fig. 3. Comparison of rice, weed, and soil coverages
Different letters on the bar indicate significant differences at 5% level (Tukey HSD).


- Affiliation
-
Japan International Research Center for Agricultural Sciences Social Sciences Division
Japan International Research Center for Agricultural Sciences Crop, Livestock and Environment Division
- Classification
-
Research
- Research project
- Program name
- Term of research
-
FY2020(FY2016~FY2020)
- Responsible researcher
-
Kawamura Kensuke ( Social Sciences Division )
Asai Hidetoshi ( Crop, Livestock and Environment Division )
ORCID ID0000-0003-0125-1234KAKEN Researcher No.: 30599064Phongchanmixay Sengthong ( National Agriculture and Forestry Research Institute of Laos )
- ほか
- Publication, etc.
-
Kawamura K et al. (2020) Plant Production Science, 24(2):198-215https://doi.org/10.1080/1343943X.2020.1829490
- Japanese PDF
-
2020_C05_A4_ja_0.pdf1.65 MB
2020_C05_A3_ja_0.pdf1.61 MB
- English PDF
-
2020_C05_A4_en.pdf1.53 MB
2020_C05_A3_en.pdf1.53 MB
- Poster PDF
-
2020_C05_poster.pdf1.1 MB
* Affiliation at the time of implementation of the study.