Estimation of rice grain yield by canopy hyperspectral sensing of paddy fields at the booting stage
Description
Remote sensing is a promising tool for assessing growth status and predicting rice yield. Recent advances in unmanned aerial vehicles (UAVs) and sensor technologies have enabled farmers to frequently observe the paddy fields at low-altitudes. However, the optimal timing of UAV observations and the suitable sensor specifications for yield prediction are not clearly understood. Therefore, with the aim of improving UAV utilization for the future, field hyperspectral (HS) measurement at canopy scale was performed in a paddy field, and the optimum growth stage and spectral waveband for yield prediction were clarified.
The experimental results are summarized as follows:
- Canopy hyperspectral measurements were conducted at different growth stages (Fig. 1, T1: Panicle initiation, T2: Booting stage, and T3: Milk stage) in an experimental paddy field where six Lao rice cultivars were tested with three replicates at the Rice Research Center (RRC) of the National Agriculture and Forestry Research Institute (NAFRI), Laos. Partial least squares (PLS) regression analyses that were not affected by the collinearity of HS data (400–930 nm, 531 bands) were performed to predict grain yield of rice. The predictive accuracies at three different growth stages were compared.
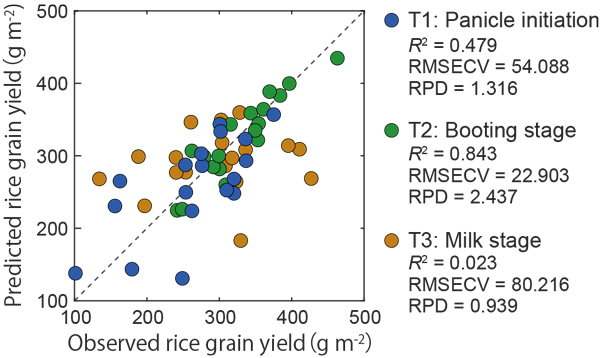
- Among the three growth stages, the highest values for predictive accuracy (R2 = 0.843) and reproducibility of the model (RPD > 2.43) were obtained at the booting stage (Fig. 2).
- Although the predictive accuracy and reproducibility values were low (R2 = 0.479, RPD = 1.316), the grain yield was predicted in the panicle initiation stage (Fig. 2).
- Grain yield might be difficult to predict after the milk stage when the rice plant’s leaf color turns yellow (Fig. 2).
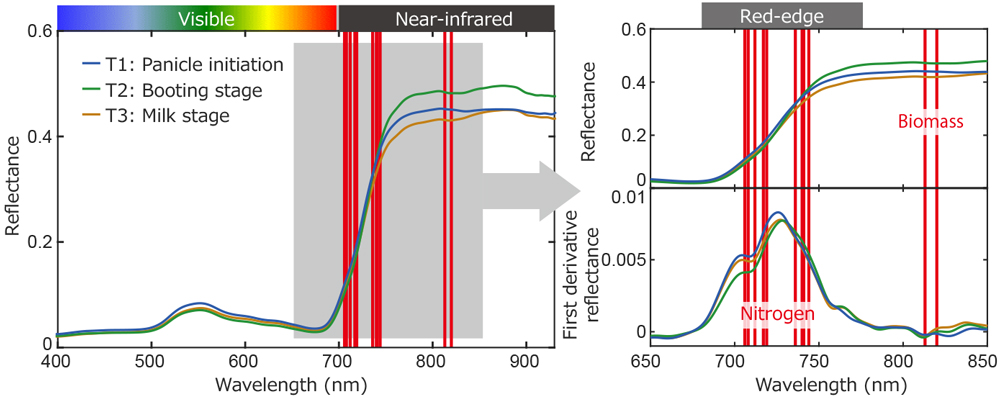
- Based on the selected wavebands in the PLS model at booting stage when the growth reaches its peak, the red-edge (700–760 nm) and near-infrared (810–820 nm) wavelength regions were selected as important wavebands for yield prediction (Fig. 3). These wavelengths are previously known to be closely related to plant aboveground biomass and nitrogen content, and they can be used to estimate the nutritional status of rice.
These results indicated that grain yield of rice could be predicted with practical accuracy by field HS measurement at the booting stage. Such timely and accurate rice yield assessments approximately one month prior to harvest will enable staffs at the regional agriculture and forestry offices and parties concerned with the rice market to quantify rice production, supply and market prices. Moreover, by installing a camera capable of measuring the red-edge and near-infrared wavelengths on UAVs, it may be possible to forecast yield over a wide area. It should be noted, however, that further analysis is required to verify whether similar results can be obtained for cultivars in other areas, especially those with large differences in traits (e.g. plant height)
Figure, table
-
Fig. 1. Plant height and the timing of field HS measurements at different growth stages in a paddy field.
Source of rice plant image data: http://www.knowledgebank.irri.org/decision-tools/growth-stages-and-impo… -
Fig. 2. Observed and predicted values of rice grain yield using PLS regression for datasets T1, T2, and T3 (n = 18).
RMSECV: Root mean squared errors of cross-validation using leave-one-out method.
RPD: Residual predictive deviation. The criteria for determination are (1) RPD < 1.15: unpredictable, (2) 1.16–1.40: weakly correlated, (3) 1.71–2.42: capable of screening, and (5) >2.43: possible to estimate with practical accuracy. -
Fig. 3. Canopy reflectance and selected wavebands (red bars) in the ISE-PLS model for booting stage (T2).
- Affiliation
-
Japan International Research Center for Agricultural Sciences Social Sciences Division
- Research project
- Program name
- Term of research
-
FY2018(FY2016-FY2020)
- Responsible researcher
-
Kawamura Kensuke ( Social Sciences Division )
Ikeura Hiroshi ( Rural Development Division )
Phongchanmixay Sengthong ( National Agriculture and Forestry Research Institute of Laos )
- ほか
- Publication, etc.
-
https://doi.org/10.3390/RS10081249
Kawamura K et al. (2018) Remote Sensing, 10(8):1249
- Japanese PDF
-
A4515.44 KB
A3265.44 KB
- English PDF
-
A4486.82 KB
A3325.96 KB
- Poster PDF
-
2018_C01_poster.pdf702.49 KB


