Improvement of rice grain yield by predicting the optimum sowing period for rainfed rice areas in the Asian monsoon region
Description
Unlike irrigated rice fields, rainfed rice areas in the Asian monsoon region depend mainly on rainfall for water supply, bringing down rice productivity to nearly half of those in irrigated areas. Despite this fact, rainfed rice areas play a crucial role in meeting future demand for the staple food; thus, it is imperative that high and stable productivity is achieved through appropriate technology development. Rainfall pattern changes year to year and rainfed rice farmers can hardly anticipate the optimum sowing period for better grain yield. Seasonal climate prediction is relevant for the current problems in rainfed areas, and the expected technology for predicting rice grain yield will be applied and developed through ORYZA, a crop growth modelling tool. SINTEX-F, the coupled ocean-atmosphere general circulation model developed by the Japan Agency for Marine-Earth Science and Technology (JAMSTEC), has a few months to one-year lead time predictability and is used for grain yield prediction through ORYZA, which in turn requires daily weather data to obtain grain yield as a function of sowing timings.
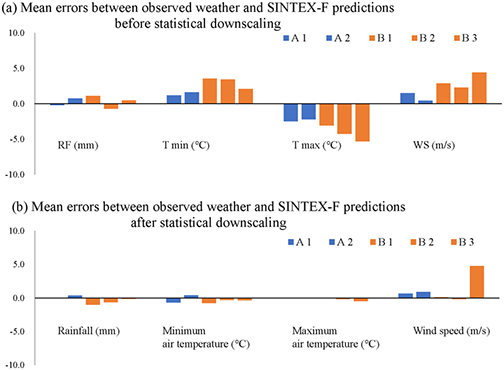
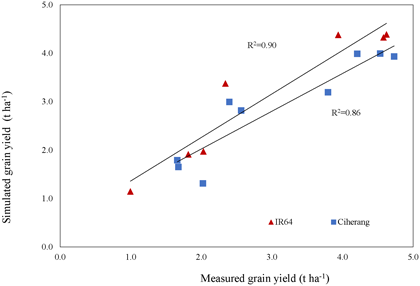
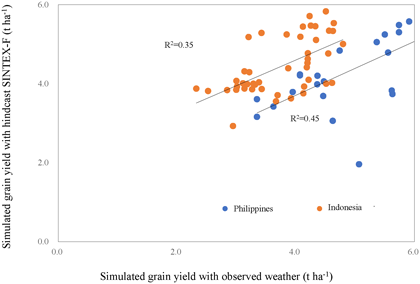
SINTEX-F is designed for predicting the El Niño-Southern Oscillation (ENSO), which has a high correlation to the Asian monsoon. However, SINTEX-F has a bias, hence it cannot be directly used for ORYZA. Thus, the outputs need to be corrected through statistical downscaling within 100 km2. The results through statistical downscaling of SINTEX-F outputs show a high correlation with locally observed weather data (Fig. 1). On the other hand, model fit of ORYZA for grain yield simulation is excellent even for different sowing timings (Fig. 2). With these obtained results, grain yields can be predicted through hindcast analysis of ORYZA with downscaled predictions as it demonstrates a high correlation with grain yields obtained with observed weather data (Fig. 3).
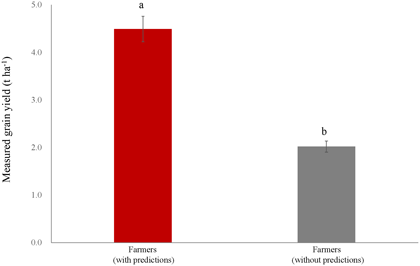
When Ciherang, one of the most popular rice varieties in Indonesia, was grown with the recommended fertilizer application in Central Java, the grain yield by farmers who based their sowing timing on predictions was higher than those who missed the optimum timing because they did not rely on predictions (Fig. 4). The improvement in grain yield for the first group of farmers was significant when compared to the area’s average grain yield, which was 3.42 t ha-1 (Boling et al. 2008).
The obtained results can be applied to improve the predictability of WeRise, a decision support system for rainfed rice areas and another decision support system for rice that is operated in Indonesia. However, the improvement in grain yield should be combined with appropriate fertilizer management in addition to optimum sowing timings. SINTEX-F predictions should be updated once a year and this entails a cost of 60,000 JPY/100 km2. Other sources for seasonal climate predictions should be scouted in target countries in Southeast Asia for sustainable operation of the developed technology. In addition, a crop, soil, and local weather database must be developed as it is a prerequisite for ORYZA operation.
Figure, table
-
Fig. 1. Statistical downscaling for bias correction of SINTEX-F predictions.
A1, A2: Sites in the Philippines; B1, B2, B3: Sites in Indonesia -
Fig. 2. Accuracy of ORYZA for predicting grain yields at different sowing dates
Red triangle: IR64, Blue square: Ciherang, each point represents its sowing date -
Fig. 3. Grain yield predictability through statistically downscaled SINTEX-F in ORYZA
-
Fig. 4. Improvement in farmers’ grain yield with predictions for optimum sowing timing.
Bars in the graph show measured grain yield for the group of farmers with predictions for optimum sowing period and others without predictions. Five farmers were selected randomly for each group. Farmers with predictions were instructed for sowing period (from November 6 to December 10) and variety, while farmers without predictions were instructed only for variety. Sowing period for farmers without predictions was from October 10 to October 25. Different alphabets in the graph mean significant differences at 5% level by Tukey’s test.
- Affiliation
-
Japan International Research Center for Agricultural Sciences Crop, Livestock and Environment Division
- Program name
- Term of research
-
FY2018(FY2011-FY2020)
- Responsible researcher
-
Hayashi Keiichi ( Crop, Livestock and Environment Division )
Llorca Lizzida ( International Rice Research Institute )
Agbisit Ruth ( International Rice Research Institute )
Bugayong Iris ( International Rice Research Institute )
Ishimaru Tsutomu ( National Agriculture and Food Research Organization (NARO) )
- ほか
- Publication, etc.
-
https://doi.org/10.1016/j.agsy.2018.01.007
Hayashi K et al. (2018) Agricultural Systems, 162:66-76
- Japanese PDF
-
A4288.71 KB
A3215.67 KB
- English PDF
-
A4190.34 KB
A3244.18 KB
- Poster PDF
-
2018_A03_poster.pdf282.47 KB


