The optimum application patterns of phosphate rock direct application under several agroecological zones for rainfed lowland rice cultivation in West Africa
Description
Phosphorus (P) is a finite resource that is difficult to reuse once it is released into the environment, in as much as P that is used in agriculture and flows into the ocean cannot be recovered. Studies for efficient P use in agriculture are being carried out internationally, especially in Africa where the use of local phosphate rock (PR) will be expanded as an affordable P resource. However, PRs in Africa are considered to be of low grade due to its low solubility and impurities such as quartz, iron, and aluminum, which are present in large amounts. Because local PRs are not sufficiently utilized, a solubility improvement technology through calcination has been studied (JIRCAS Research Highlights 2019). On the other hand, direct application of low-grade PR is expected to be effective in paddy rice cultivation, but the cultivation environment for rain-fed rice cultivation in Africa is diverse, and the application effect is uneven. Therefore, we investigated the effects of direct PR application in different agricultural ecological zones (AEZs) for rainfed rice cultivation for three years in West Africa and the optimum patterns for PR application with due consideration to the P use efficiency in each cultivation environment.We have conducted PR application experiments in farmers’ fields in three AEZs, namely, the Sudan Savanna Zone (SS), Guinea Savanna Zone (GS), and Equatorial Forest Zone (EF), representing the three cultivation environments of rainfed rice cultivation in West Africa. Table 1 shows the chemical properties of the surface soil of the rainfed paddy field in each AEZ. In each AEZ, a Non-P plot (NK), a PR direct application plot (PR), and a triple superphosphate application plot (TSP) was set up. Powdered PR obtained from the Kodjari deposit in Burkina Faso was used in this study. Each treatment plot was divided into a P continuous application plot and a residual effect plot in the second year. Non-P application was conducted in the third year (Fig. 1). In each year, rice grain yields and biomass were investigated.
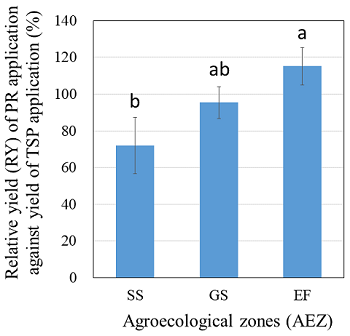
Results showed that the yield ratio (RY) between the PR plot and the TSP plot increased in the order of SS < GS < EF with the difference in annual precipitation in the first application (Fig. 2). From the combination of fertilizer application frequencies surveyed, we selected one with high phosphorus use efficiency (PUE) and high relative agricultural efficiency (RAE) as the optimum application frequency for PR application in each AEZ. For SS and GS, "2 years continuous application following 1 year residual effect" and for EF, "1 year application following 2 years residual effect", the amount of PR application can be the minimum, and the same yield as the annual application can be obtained (Table 2).
Figure, table
-
Fig. 1. Outline of phosphate rock direct application experiment
-
Table 1. Surface soil chemical properties under each agroecological zone
Agroecological zone (AEZ) SS GS EF Annual precipitation mm 800 1,100 1,350 pH (H2O) 5.40 5.72 5.12 Available P mg P kg-1 1.90 8.51 4.99 Total C g kg-1 7.73 4.31 10.34 Total N g kg-1 0.58 0.41 0.82 Exchangeable Ca cmolc kg-1 2.48 1.88 5.11 Exchangeable Mg cmolc kg-1 0.93 1.11 2.01 Exchangeable K cmolc kg-1 0.18 0.15 0.24 SS: Sudan savanna (Burkina Faso, Saria), GS: Guinea savanna (Ghana, Tamale),
EF: Equatorial Forest (Ghana, Kumashi)
-
Fig. 2. First year application effect of phosphate rock under each agroecological zone
-
Table 2. Phosphate rock direct application effect with several application patterns under each agroecological zone
PR application patterns
/Total phosphate application
(kg P2O5 ha-1 3 years-1)Averaged rice grain yield Relative agronomic efficiency† Phosphate use efficiency†† (t ha-1 year-1) (RAE %) (kg kg P2O5-1 year-1) SS GS EF SS GS EF SS GS EF -P -P -P 0 2.42 c 2.02 c 3.63 b +P -P -P 135 2.79 b 2.67 b 5.02 a 20.3 62.6 96.5 8.3 14.4 30.9 +P +P -P 270 3.65 a 3.13 a 4.99 a 69.6 84.6 84.9 13.7 12.4 15.2 +P +P +P 405 3.85 a 3.12 a 5.02 a 63.9 77.2 89.4 10.6 8.2 10.3 “+P/-P” indicates with and without P application in each year. Different alphabets denote 5% significant difference by Tukey-Kramer method.
†Relative agronomic efficiency (RAE): (Yield in PR – Yield in Control)/(Yield in TSP – Yield in Control) × 100
†† Phosphate use efficiency: (Yield in PR – Yield in Control)/Annual phosphate application rate
- Affiliation
-
Japan International Research Center for Agricultural Sciences Crop, Livestock and Environment Division
- Classification
-
Research
- Program name
- Research Project
-
Establishment of the model for fertilizing cultivation promotion using Burkina Faso phosphate rock
- Term of research
-
FY2020(FY2009~FY2021)
- Responsible researcher
-
Nakamura Satoshi ( Crop, Livestock and Environment Division )
ORCID ID0000-0002-0952-5618KAKEN Researcher No.: 00749921Nagumo Fujio ( Crop, Livestock and Environment Division )
KAKEN Researcher No.: 20399372Tobita Satoshi ( )
Fukuda Monrawee ( Crop, Livestock and Environment Division )
Kanda Takashi ( Crop, Livestock and Environment Division )
Issaka Roland ( Soil Research Institute, CSIR, Ghana )
Dzomeku Israel K. ( University for Development Studies )
Saidou Simpore ( Environmental Institute for Agricultural Research, Burkina Faso )
Buri Moro ( Soil Research Institute, CSIR, Ghana )
Adjei Eric O. ( Soil Research Institute, CSIR, Ghana )
Avornyo Vincent K. ( University for Development Studies )
Awuni Joseph A. ( University for Development Studies )
Barro Albert ( Environmental Institute for Agricultural Research, Burkina Faso )
Jonas Dambinga ( Environmental Institute for Agricultural Research, Burkina Faso )
- ほか
- Publication, etc.
-
Nakamura S et al. (2020) Tropical Agriculture and Development, 64:97-106.
Nakamura S et al. (2016) Nutrient Cycling in Agroecosystem, 106:47-59.https://doi.org/10.1007/s10705-016-9788-8 - Japanese PDF
-
2020_A10_A4_ja.pdf354.04 KB
2020_A10_A3_ja.pdf353.41 KB
- English PDF
-
2020_A10_A4_en.pdf281.06 KB
2020_A10_A3_en.pdf431.8 KB
- Poster PDF
-
2020_A10_poster.pdf344.93 KB
* Affiliation at the time of implementation of the study.

