Yam variety identification toolkit: Step 4

Step 4

As mentioned in “How to identify variety using SSR markers”, you can identify the genetic profile of tested material using band patterns shown in gel image.

As well as potential SSR marker sets which can identify the varieties/lines you selected with minimum number of markers, “Minimum SSR Marker Finder for Guinea Yam” provides the list of band pattern (allele size) of the materials selected by yourself. And based on this information, you can identify your material (Case 1) or detect mechanical mixture from other materials (Case 2).
Case 1: Identify your materials
If you grow several yam varieties in separate plots, and could not identify which plot is for which variety due to misplaced labels, how can you confirm the variety grown in each plot? Yam Variety Identification Toolkit will help you to identify your materials.
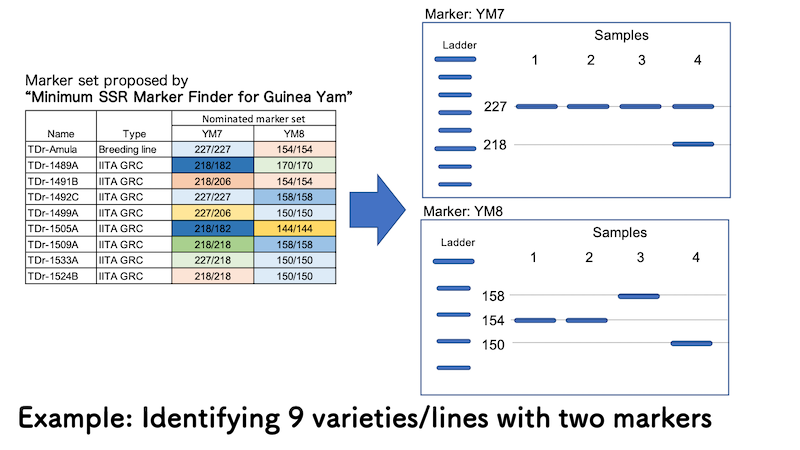
In above example case, only two SSR marrkers out of 16 can differrenciate 9 varieties/lines. You can understand from the output of “Minimum SSR Marker Finder for Guinea Yam” that TDr-1533A, one of the germplasms from IITA genetic resource center will show two bands at allele size 227 bp and 218 bp (227/218) for YM7, and single band at allele size 150 bp (150/150) for YM8. Based on this information, you can identify Sample 4 is TDr-1533A.
In the same way, Samples 1 and 2 are TDr-Amula since both samples show single band at allele size 227 bp (227/227) for YM7 and single band at allele size 154 (154/155) for YM8. While Sample 3 shows similar band pattern with TDr-Amula for YM7, it was identified as TDr-1492C with single band at allele size 158 bp (158/158) for YM8.
Case2: Confirm your materials are pure or mixed
If you are handling TDr-Amula as a target material and want to confirm the stored tuber stocks are purely this variety or mixed with TDr-1533A growing in the same field, Yam Variety Identification Toolkit is also helpful.
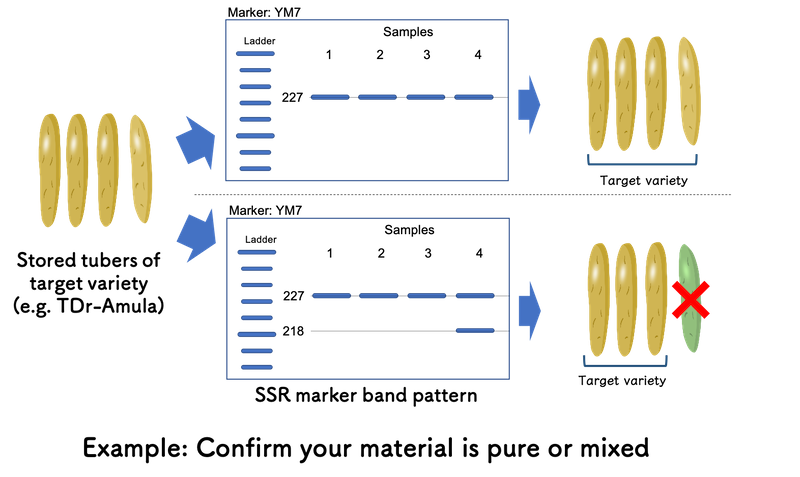
Based on the output of “Minimum SSR Marker Finder for Guinea Yam”, YM7 is effective to distinguish TDr-Amula and TDr-1533A. If the gel image only shows single band at allele size 227 bp (227/227) for YM7, your tuber stocks are purely TDr-Amula.
However, if you can observe the sample shows the band at allele size 218 bp addition to one in allele size 227 bp, it suggests the sample is from TDr-1533A mechanically mixed throughout various processes. By removing the sample, you can confirm all your tuber stocks are purely TDr-Amula before your next actions, such as seed tuber preparation for crossing block (Please also see “Use case example” page - section “in yam improvement program”).
This “Confirm your materials are pure or mixed” is also useful in large-scale seed system to confirm the purity of stock materials for propagation, or propagated seed materials (Please also see “Use case example” page - section “in large-scale seed system”). To handle materials in large quantities, we propose “Sample bulking method” which could reduce the cost and time per plant drastically. Please also see “Sample bulking” page.
Tips: Is image analysis software necessary?
If you handle large number of samples at once, an image analysis software would be very useful and recommendable. However, if you can identify difference of band pattern by visual observation, it will be enough to distinguish varieties/lines and reduce your work.
To have clear difference of band pattern among varieties, your careful selection of marker set is critical at “Step 1” using output of “Minimum SSR Marker Finder for Guinea Yam”.
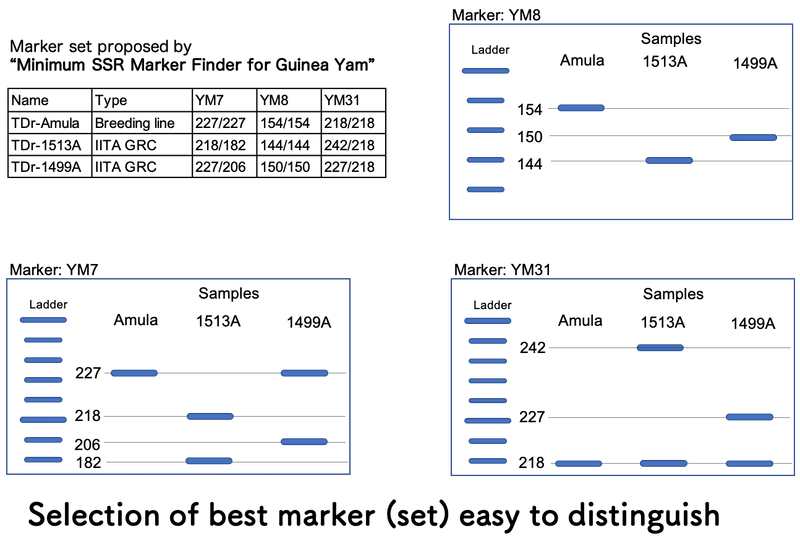
For example, three varieties/lines, TDr-Amula, TDr-1513A and TDr-1499 can be distinguished by single SSR marker, either YM7, YM 8 or YM31, based on the output of “Minimum SSR Marker Finder for Guinea Yam”. YM8 only shows different band pattern within a narrow range (10 bp difference) of allele size from 144 to 154 bp. However, for both YM7 and YM31, those three varieties/lines show wider range of allele size (show more clear differences among bands) and even different number of bands which help you to distinguish varieties/lines without precise analysis using an image analysis software.
The list of expected allele size found in our previous study was summarized in supplemental document “the alleles found among 447 Dr accessions by SSR markers for white Guinea yam (supplement 1. pdf)”. And this document provides useful information for your selection of marker set.
Also, if you have difficulty or question for the selection of suitable marker set, please contact us via our inquiry form.
Tips: Adjustment of allele size
Because the variation of SSR is based on the difference of the repeat number of di- or tri- nucleotide sequence such as difference between (---CACACACA---) and (---CACACACACACA----), each fragment size should show every two or three bp intervals (not continuous number). The allele size indicated in the output of “Minimum SSR Marker Finder for Guinea Yam” is adjusted to this "theoretically possible" allele size.
Sometimes, due to the condition of gel electrophoresis, the measured allele size using image analysis software may not be exact same (with a few bp difference) form the allele size indicated in the output of “Minimum SSR Marker Finder for Guinea Yam”. This small difference of measured allele size and theoretically possible allele size is within possible error, and “the alleles found among 447 Dr accessions by SSR markers for white Guinea yam (supplement 1. pdf)” will be helpful to adjust measured allele size.
If you have any question, please contact us via our inquiry form.