Soil phosphorus availability for rice plants can be rapidly estimated by laboratory visible and near-infrared spectroscopy
Description
Phosphorus (P) deficiency is a major constraint to rice production in highly weathered soils of tropical agroecosystems. Therefore, rapid evaluation of soil phosphorus availability is crucial toward realizing efficient fertilizer management for increasing crop production. As a laboratory proximal sensing technique, the capability of visible and near-infrared (Vis-NIR) spectroscopy with partial least squares (PLS) regression to determine soil properties has been demonstrated. However, the evaluation of soil P is still a challenging task. Thus, we aimed to develop a model for estimating oxalate-extractable P (Pox), which represents the soil P supply capacity for rice crops in lowland and upland fields in the central highlands of Madagascar.
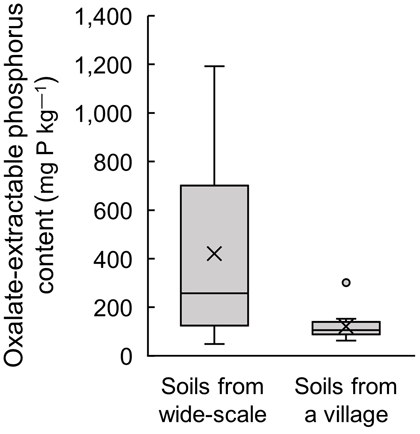
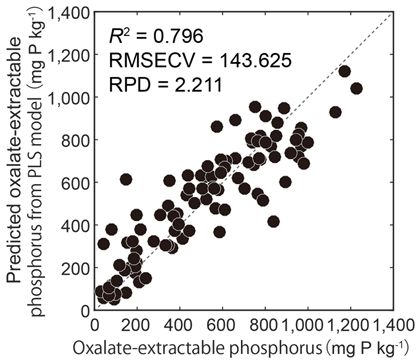
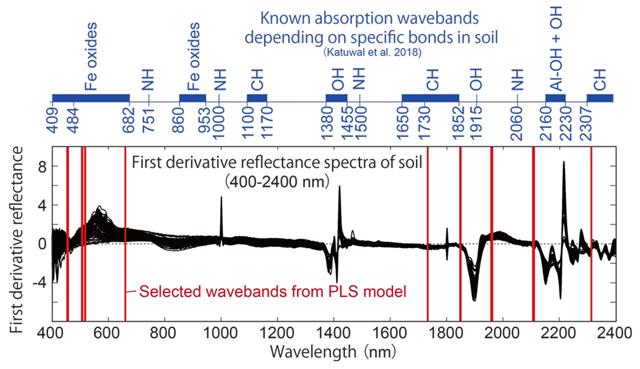
Pox content was measured for soil samples (n = 51) collected from the surface layer (0–15 cm depth) in rice fields in the central highlands of Madagascar. Large spatial variations in Pox were observed in soil samples collected from a wide range of soil types over a wide area and even in soil samples from a village (Fig. 1). This highlighted the importance of developing a prompt assessment method for P availability in multiple soil samples. Soil samples were scanned by a portable spectroradiometer (FieldSpec, ASD Inc.) in a dark room to measure spectral reflectance in the Vis-NIR region (400–2400 nm), and subsequently a calibration model was developed for estimating Pox using selected wavebands on first derivative reflectance spectra with genetic algorithm-based PLS regression (GA-PLS). With this PLS model, Pox content in soil can be rapidly estimated with high accuracy and reproducibility (Fig. 2). The selected wavebands in the GA-PLS model were found to be relevant to chemical associations of Pox in soils bound to Al and Fe oxides and organic compounds (Fig. 3).
The Pox content can be accurately and rapidly predicted from laboratory Vis-NIR spectroscopy with GA-PLS regression; it takes only one minute to measure the spectral reflectance for one soil sample. Therefore, the calibration model can be applied to assess the P deficiency level with high spatial variation in lowland and upland rice fields for appropriate fertilizer management. Research institutes, such as regional agricultural research centers or universities, can help handle the measurement because the portable spectroradiometer is not affordable for local farmers. An alternative cheap edition of the spectroradiometer using specific wavebands relevant to soil chemical associations of Pox in soils is needed. Further applicability of this model should be tested particularly in soils with high pH and Ca-associated P content, and in soils with high sand content.
Figure, table
-
Fig. 1. Spatial variation of oxalate-extractable P
The bar on the left indicates Pox content of soil samples collected within an area of 100 km radius (n = 35), and the bar on the right indicates Pox content of soil samples collected within a village (n = 16). The coefficients of variance are 0.85 and 0.45, respectively. -
Fig. 2. Relationship between observed and predicted values of soil oxalate-extractable P using the PLS model
RMSECV: Root mean squared errors of cross-validation using the leave-one-out method.
RPD: Residual predictive deviation. The criteria for determination are (1) RPD < 1.15: unpredictable, (2) 1.16–1.40: weakly correlated, (3) 1.41–1.70: screening with low accuracy, (4) 1.71–2.42: capable of screening, and (5) >2.43: possible to estimate with practical accuracy. -
Fig. 3. Selected wavebands (red bars) in the PLS model
- Affiliation
-
Japan International Research Center for Agricultural Sciences Crop, Livestock and Environment Division
Japan International Research Center for Agricultural Sciences Social Sciences Division
- Classification
-
Technical A
- Program name
- Term of research
-
FY2019 (FY2017-FY2021)
- Responsible researcher
-
Nishigaki Tomohiro ( Crop, Livestock and Environment Division )
KAKEN Researcher No.: 80795013Kawamura Kensuke ( Social Sciences Division )
Tsujimoto Yasuhiro ( Crop, Livestock and Environment Division )
ORCID ID0000-0001-7738-9913KAKEN Researcher No.: 20588511Andriamananjara Andry ( University of Antananarivo )
Rabenarivo Michel ( University of Antananarivo )
Rakotoson Tovohery ( University of Antananarivo )
Razafimbelo Tantely ( University of Antananarivo )
ORCID ID0000-0003-2101-9715 - ほか
- Publication, etc.
-
https://doi.org/10.1007/s11104-018-3869-1
Nishigaki T et al. (2019) Plant and Soil, 435(1-2):27-38
https://doi.org/10.3390/rs11050506Kawamura K et al. (2019) Remote Sensing, 11(5):506
- Japanese PDF
-
2019_B01_A4_ja.pdf2.64 MB
2019_B01_A3_ja.pdf318.7 KB
- English PDF
-
2019_B01_A4_en.pdf520.46 KB
2019_B01_A3_en.pdf184.22 KB
- Poster PDF
-
2019_B01_poster_fin.pdf395.25 KB


