A farm management model for assisting smallholder farmers in Africa
Description
Most farmers in Sub-Saharan Africa are smallholders. This condition threatens food security in the region as smallholders cultivate only a few hectares of farmlands and face constraints on income generation. Although there is a strong focus on new agricultural technologies and policy interventions, only a few have shed light on farm management strategies that are acceptable and feasible to smallholders for improving their diets and livelihoods. The objective of this research, therefore, is to develop a new farm management model for assisting African smallholders.
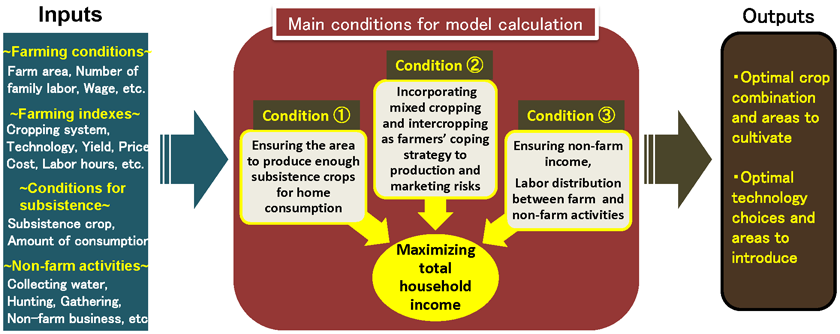
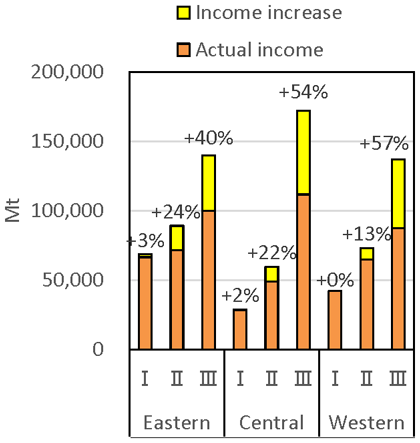
Using the linear programming approach, we constructed a farm management model that computes the optimal crop and technology choices along with the optimal scales of introducing these crops and technologies to maximize the total household income. With the necessary parameters covering farming conditions and indexes, conditions for food subsistence, and non-farm activities, the model gives a true picture of farm management optimized for African smallholders with their principal livelihood needs satisfied. These needs include 1) ensuring the area to produce enough subsistence crops for home consumption, 2) mixed cropping and intercropping as smallholders’ coping strategies to production and marketing risks, and 3) ensuring non-farm income and labor distribution of farm and non-farm activities (Fig. 1). As a case study, we applied this model to smallholder farmers in the Nacala Corridor, northern Mozambique, and analyzed the optimal crop combinations in three different agroecological zones and farming scales. The results indicate that risk dispersion based on mixed cropping is effective especially in the eastern zone, which witnesses more frequent droughts and price fluctuations of agricultural products than other zones. Smallholders can also derive improved livelihoods from producing the most lucrative beans (e.g. groundnut, soybean) and tubers (e.g. sweet potato) cultivated in each zone, with the major food staples produced as well, to achieve food self-sufficiency especially among those with more than 1 ha of farmlands (Table 1). As in Figure 2, their total income could increase substantially while those with less than 1 ha have little room to increase their income because of the difficulty in meeting food self-sufficiency needs with the actual crop yields. To facilitate the model analyses, we also developed the user-friendly programs named BFMe (in English) and BFMmz (in Portuguese). Using these programs, the expected local users including agricultural extension agencies can easily implement the model to identify optimal farming plans for smallholders as well as scenarios of their technology uptake.
The model allows not only observed values but also predicted values for computation. One may use, for instance, the yields predicted using a crop model. Samples of smallholder farming in the three zones of Nacala Corridor are also available. Some may derive the optimal farming plans from using these samples for reference or change the parameters for simulation, while others may use original data collected for their own analyses.
Figure, table
-
Fig. 1. A farm management model reflecting the conditions of African smallholder farming
-
I: Household category with less than 1 ha of farmlands. II: Household category with 1 to 2 ha of farmlands. III: Household category with more than 2 ha of farmlands. The optimal combinations consist of major crops and cropping systems identified by a field survey of 645 randomly-sampled smallholder farmers. The observed values of their farming conditions and indexes and non-farm activities are reflected into the model.Table 1. Optimal crop combinations in three different zones of the Nacala Corridor Optional cropping area (ha) I II III Eastern Total area 0.68 1.44 3.05 Cassava+Maize+Cowpea mixed cropping 0.63 0.67 0 Cassava+Maize+Cowpea+Peanut mixed cropping 0 0.69 2.92 Sweet potato monocropping 0.05 0.08 0.13 Central Total area 0.67 1.44 3.6 Maize monocropping 0.29 0.48 0.54 Sorghum monocropping 0.03 0.42 0.47 Sorghum+Pigeon pea mixed cropping 0.32 0 0 Soybean+Pigeon pea mixed cropping 0 0.54 2.59 Rice monocropping 0.03 0.04 0.02 Western Total area 0.71 1.49 3.9 Maize+Common bean mixed cropping 0.65 0.85 0.95 Sweet potato monocropping 0.06 0.64 2.95 -
Fig. 2. Income increase by optimizing crop combinations in each zone and farming scale.
I, II, III: Same as Table 1.
Mt: Metical (currency of Mozambique).
Rate of income increase is indicated above the bars.
- Affiliation
-
Japan International Research Center for Agricultural Sciences Social Sciences Division
- Research project
- Program name
- Term of research
-
FY2018(FY2013-FY2018)
- Responsible researcher
-
Koide Junji ( Social Sciences Division )
ORCID ID0000-0003-1726-4400Yamada Ryuichi ( Tokyo University of Agriculture )
KAKEN Researcher No.: 70760883Oishi Wataru ( University of Tsukuba )
Nhantumbo Amancio ( Agricultural Research Institute of Mozambique )
Salegua Venancio ( Agricultural Research Institute of Mozambique )
Sumila Cassamo ( Agricultural Research Institute of Mozambique )
- ほか
- Publication, etc.
-
https://doi.org/10.7310/arfe.54.53
Koide J. et al. (2018) Journal of Rural Problems 54(2):53-59
Koide J. et al. (2018) Japanese Journal of Farm Management 56(3):1-11
- Japanese PDF
-
A4517.9 KB
A3316.5 KB
- English PDF
-
A4343.44 KB
A3357.11 KB
- Poster PDF
-
2018_B02_poster.pdf454.39 KB


