Estimation of rice production in 1km mesh in Bangladesh using multiple regression analysis and GIS
Country
Bangladesh
Description
Impact assessments and countermeasures to global climate change are urgently required in developing countries vulnerable to environmental fluctuations. Agricultural systems in developing countries significantly depend on natural conditions, hence principal production areas are likely to be established in areas where meet adequate land and climate conditions for cultivation. Potential land suitability maps independent from climate condition are necessary in order to assess the impact of climate change to principal production areas, i.e., suitable areas, spatially and quantitatively.
To this end, a method to estimate rainy and dry season rice production in 1km mesh in Bangladesh was developed using multiple regression analysis and GIS with fundamental geospatial dataset. This proposed model (Fig.1) employed several combinations of six land factors representing Slope (3 categories), Land Type (5 categories), Soil Texture (5 categories), Drainage (6 categories), Soil Permeability (3 categories), and Soil Salinity (4 categories) derived from Bangladesh Country Almanac (BCA) Ver.3. The BCA, prepared and provided by CIMMYT-Bangladesh, is a national geospatial dataset containing sub-district level information.
The distributed areas of 26 attributes, representing six land factors in 463 sub-districts (or Thana), were assumed as explanatory variables while the productions of rainy and dry season rice in 2002-2003 were respectively assumed as response variable and then, a multiple regression analysis was executed. Adjusted coefficients of determination (adjusted R2) of the multiple regression equations for rainy and dry season rice were significantly high at 0.903 and 0.823, respectively.
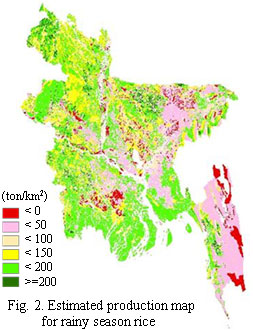
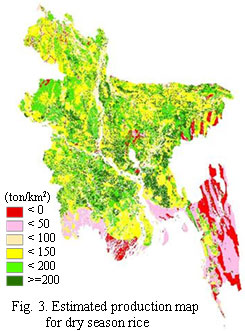
The partial regression coefficients were assigned into attribute tables for six land factor maps, and then rice production per 1 km x 1 km mesh was estimated by map calculation in GIS (Figs. 2 and 3). The total amount of map calculation compiled by new and old provincial boundaries showed high correlation with rice productions in the statistics, and the mean error in each province was within 23-33% (Table 1). This implied that the distribution of production for each mesh was accurate.
The estimated rice production in 1-km mesh is available for “baseline,” i.e., the initial value under current climate condition for climate change impact assessment. When statistics and map data are available, categorical data can be manipulated as quantitative variables in such a manner that the area of each attribute is applied for explanatory variables. It provides scalability and versatility for model development. However, this method is intended only for estimating production by the combination of attributes, not for determining the contribution of each attribute.
Figure, table
- Affiliation
-
Japan International Research Center for Agricultural Sciences Social Sciences Division
- Classification
-
Administration B
- Research project
- Program name
- Term of research
-
FY 2012 (FY 2011- FY 2015)
- Responsible researcher
-
Yamamoto Yukiyo ( Social Sciences Division )
Kobayashi Shintaro ( Social Sciences Division )
Furuya Jun ( Social Sciences Division )
MIERUKA ID: 001740Kabir Md. Shahjahan ( Bangladesh Rice Research Institute )
- ほか
- Publication, etc.
-
Yamamoto, et al. (2013), Journal of the Japanese Agricultural Systeme Society 29(1): 1-9
- Japanese PDF
-
2012_01_A4_ja.pdf97.84 KB
- English PDF
-
2012_01_A4_en.pdf196.04 KB