Nitrogen leaching and growth of sugarcane under different nitrogen fertilization levels in a subtropical island
Description
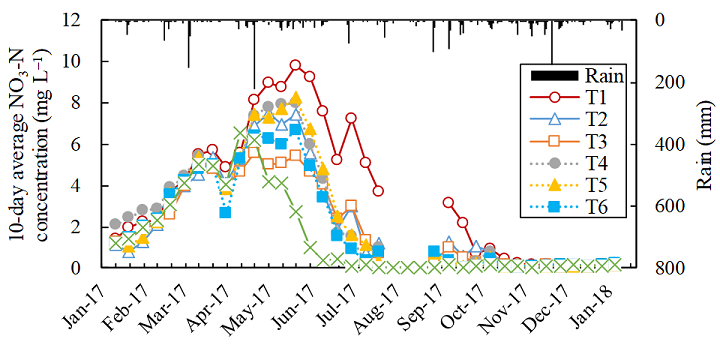
In tropical and subtropical islands where highly permeable limestone rocks are distributed, rainfall causes nitrogen (N) from chemical fertilizers to readily leach underground, with the nitrate leached from fertilization of sugarcane becoming a main source of groundwater pollution. The effect of excessive amounts of fertilizer in early growth stage of sugarcane, before the development of the root system, is limited. Therefore, it is important that fertilizer management should be appropriate for the growth characteristics of sugarcane. This study aimed to develop a fertilizer application technique that reduces N load to groundwater while maintaining sugarcane yield by using a drainage lysimeter.Our research site was the Japan International Research Center for Agricultural Sciences, Tropical Agricultural Research Front (JIRCAS-TARF), located in Ishigaki Island, Japan. Drainage lysimeters with an area of 10 m2 and a depth of 2 m were filled with dark red soil derived from limestone, and sugarcane was planted without irrigation (Fig. 1). Drainage water was collected at the bottom of lysimeters and the concentration of nitrate nitrogen (NO3-N) in drainage water was measured using a spectrophotometer. The experimental design consisted of a randomized block with two replications of a 3 × 2 factorial design and an unfertilized control, totaling 14 plots. The first factor was the N rates of the basal applications (0, 35, or 70 kg N ha-1) and the second factor was the N rates of the supplementary applications (80 or 160 kg N ha-1) (Table 1). Even when the basal N was reduced to 50% of the current fertilizer application standard (T2), the same level of yield was maintained as in T1 where 100% basal N was applied. The timing of fertilizer application is important because T4 with halved N in the supplemental fertilizer has higher yield than T3 with no basal fertilizer, even though the total amount of N applied is lower. Concentrations of NO3-N in drainage water were high in the early growth stage period from late April to late June, and high concentrations of 8 to 10 mg L-1 were detected in the conventional fertilizer rate (T1) (Fig. 2). In the supplemental N-only 50% (T4), basal N 50% (T2 and T5), and basal N 0 application (T3 and T6) plots, the accumulated N leaching was reduced by 10 kg ha-1, 12 kg ha-1, and 19 kg ha-1, respectively, compared to the current fertilizer application of 24 kg ha-1 (T1) (Fig. 3). Even if the amount of N applied under the current fertilizer application is reduced by 15% (equivalent to 35 kg ha-1), N leaching from fertilizer could be reduced by about 50% (12 kg ha-1) while maintaining the same level of sugarcane yield.
The results of this study will provide basic data for the revision of the standard fertilization (amount of fertilizer applied) for sugarcane cultivation in Okinawa Prefecture, as well as information for the analysis of N balance and dynamics in the groundwater basin. For appropriate fertilizer management, it is necessary to consider the surrounding environmental conditions in addition to reducing the amount of nitrogen. Therefore, accumulating soil and meteorological data and using them for model analysis is effective.
Figure, table
-
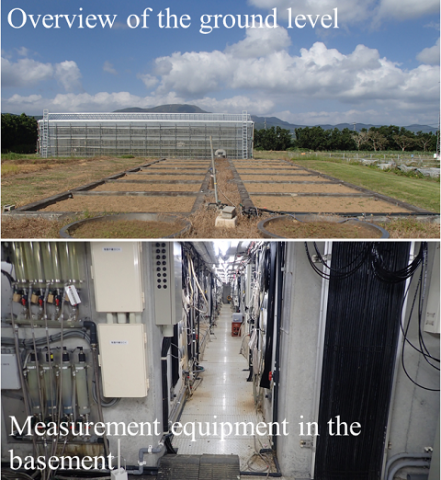
Fig. 1. Drainage lysimeters at JIRCAS-TARF
-
Table 1. Sugarcane yield and leaf area in each N treatment
Treatments Harvest survey Growth survey No. Basal N Supple-mentary N Cane yield per plot Cane yield per stalk Stalk density Leaf area in April Leaf area in August (kg ha–1) (t ha–1) (kg) (stalks m–2) (cm2) T1 70 160 91.0 1.13 a 8.4 a 83.3 a 295 a T2 35 160 88.8 1.11 a 7.9 a 84.5 a 275 a T3 0 160 76.8 1.03 a 8.4 a 87.4 a 272 a T4 70 80 83.0 1.01 a 8.4 a 98.3 a 270 a T5 35 80 74.5 1.07 a 6.8 a 86.3 a 250 ab T6 0 80 72.3 1.06 a 7.1 a 82.3 a 241 b T7 0 0 39.8 0.75 b 7.9 a 91.3 a 215 b Note 1: Treatments (T1–T7) refer to different N application rates.
Note 2: There is a significant difference between different alphabets among N treatments by Tukey method (p<0.05). -

Fig. 2. NO3-N concentration in drainage water
Note: Treatments (T1–T7) refer to different N application rates.
-
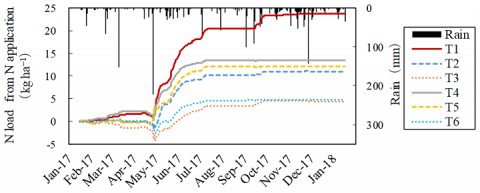
Fig. 3. N load from N application
Note 1: Treatments (T1–T7) refer to different N application rates.
Note 2: N load from N application refers to the accumulated N loads in T1 to T6 minus that in T7 (control treatment).


- Affiliation
-
Japan International Research Center for Agricultural Sciences Tropical Agriculture Research Front
- Classification
-
Research
- Research project
- Program name
- Term of research
-
FY2020(FY2016~FY2020)
- Responsible researcher
-
Okamoto Ken ( Tropical Agriculture Research Front )
ORCID ID0000-0002-4893-0034Anzai Toshihiko ( Tropical Agriculture Research Front )
Ando Shotaro ( Tropical Agriculture Research Front )
Goto Shinkichi ( Tropical Agriculture Research Front )
- ほか
- Publication, etc.
-
Okamoto, et al. (2020) Research for Tropical Agriculture, 13(2):57-67
- Japanese PDF
-
2020_A08_A4_ja.pdf313.99 KB
2020_A08_A3_ja.pdf293.46 KB
- English PDF
-
2020_A08_A4_en.pdf1.17 MB
2020_A08_A3_en.pdf728.01 KB
- Poster PDF
-
2020_A08_poster.pdf289.67 KB
* Affiliation at the time of implementation of the study.