List of traits you can use in this database
 Basic agronomic traits
 Days to flowering
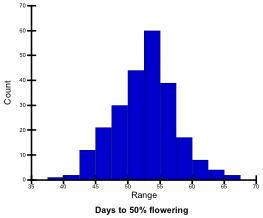
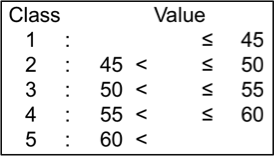
‘Days to flowering’ (DF) refers to number of days from sowing to a stage when 50% of plants have begun to flower. DF were recorded for plants sown on the same date and location each year. DF of the tested genotypes ranged from 38 to 67; they were classified into 5 levels.
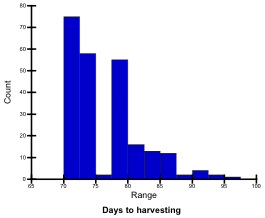
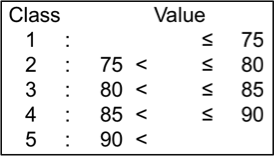
Days to harvesting
‘Days to harvesting’ (DH) refers to number of days from sowing to a stage when 95% of the pods have matured. DH of the tested genotypes ranged from 70 to 97; they were classified into 5 levels.
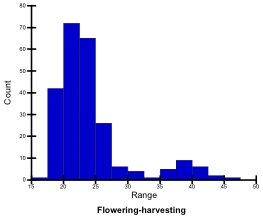
Flowering-harvesting
This refers to number of days from flowering stage to harvesting stage’. Flowering-harvesting days of the tested genotypes ranged from 16.5 to 47.0; they were classified into 5 levels.

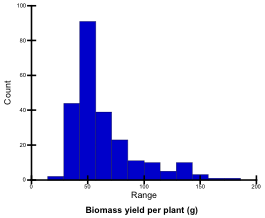
Biomass yield (g/plant)
Biomass yield per plant refers to dry weight of the harvested plants, including grain, pot sheath, leaf and stem, calculated on a per plant basis. Biomass yields (per plant) of the tested genotypes ranged from 25.3 g to 184.8 g; they were classified into 5 levels.
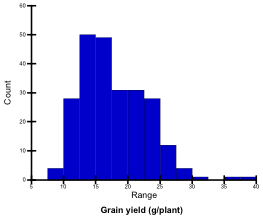
Grain yield (g/plant)
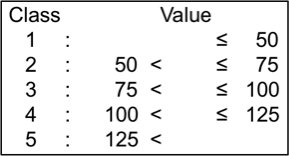
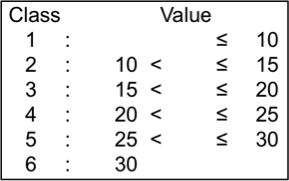
Grain yield per plant refers to weight of air-dried grain (approx. 8% moisture) calculated on a per plant basis. Grain yields (per plant) of the tested genotypes ranged from 9.5 g to 39.5 g; they were classified into 6 levels.
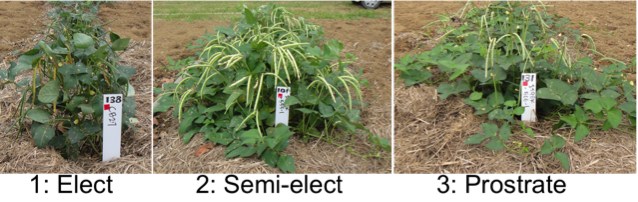
Plant type
Plant type was evaluated on the 6th week after sowing and was classified as:
1. Elect
2. Semi-elect
3. Prostrate
Pod color
Pod color was recorded when 80% of the plants had mature pods. Pod color was classified as:
1. Brown
2. Speckle
3. Light Purple
4. Purple
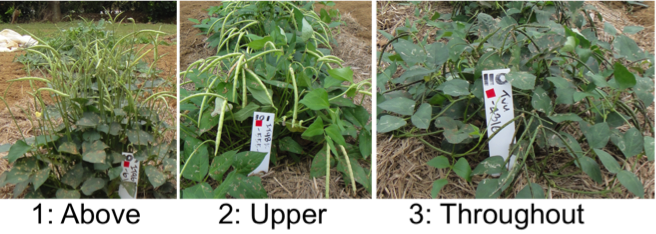
Raceme position
Raceme position was recorded when peduncles reached full length.
1. Above (Mostly above the canopy)
2. Upper (Mostly in the upper canopy)
3. Throughout (Mostly throughout the canopy)
Seed physical properties
Testa basal colour
Colour of most parts of seed testa was observed. Testa basal color was evaluated against Munsell color charts and classified as:
1. White
2. Cream
3. Light brown
4. Mid-brown
5. Dark brown
6. Red
7. Black
Testa colour characteristics
Patterns of testa colour were observed. Testa colour characteristic was classified as:
11. Single
2. Dual
3. Speckle
Eye colour
Colour of eye part of seed was observed. Eye colour was classified as:
1. Black
2. Dark brown
3. Mid-brown
Testa texture
Testa texture was classified as:
1. Smooth
2. Smooth to rough
3. Rough (fine reticulation)
4. Rough to wrinkled
5. Wrinkled (coarse folds on the testa)
Seed shape
Seed shape was classified as:
1. Kidney
2. Ovoid
3. Crowder
4. Globose
5. Rhomboid
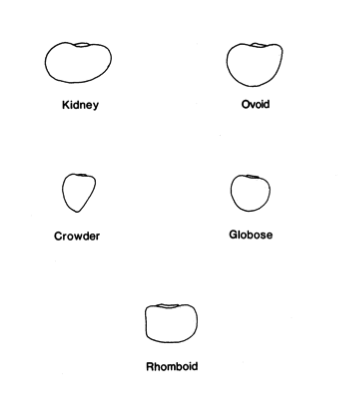
Source: IBPGR (1983) Descriptors for Cowpea. Rome, Italy: The International Board for Plant Genetic Resources
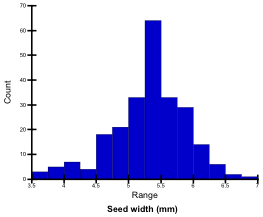
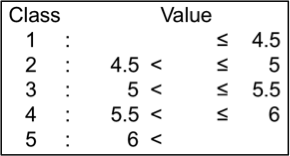
Seed width (mm)
Mean width of approx. 100 harvested mature seeds was measured using an image analysis system (Grain Scanner, Satake). Seed widths of the tested genotypes ranged from 3.7 mm to 6.8 mm; they were classified into 5 levels.
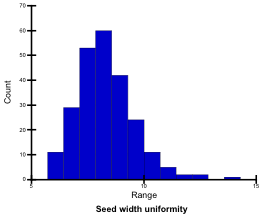
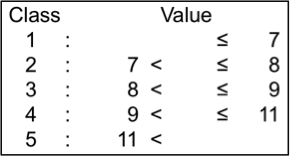
Seed width uniformity
CV (%) value of seed width was measured on approx. 100 mature seeds using an image analysis system (Grain Scanner, Satake). Seed width uniformity values of the tested genotypes ranged from 5.8 (stable) to 14.1 (unstable); they were classified into 5 levels.
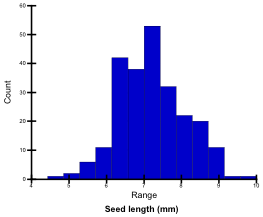
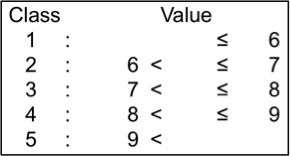
Seed length (mm)
Mean seed length of approx. 100 harvested mature seeds was measured using an image analysis system (Grain Scanner, Satake). Seed lengths of the tested genotypes ranged from 4.8 mm to 9.7 mm; they were classified into 5 levels.
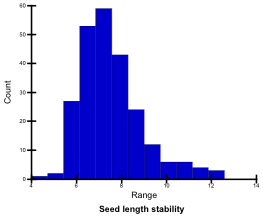
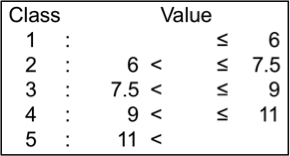
Seed length uniformity
CV (%) value of seed length was measured on approx. 100 mature seeds using an image analysis system (Grain Scanner, Satake). Seed length uniformity values of the tested genotypes ranged from 4.7 (stable) to 12.4 (unstable); they were classified into 5 levels.
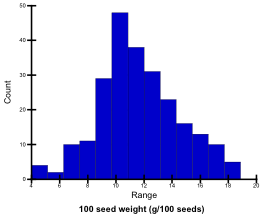
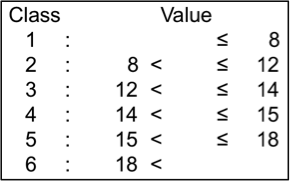
Seed weight (g/100 seeds)
Weight of 100 air-dried seeds (approx. 8% moisture) was measured. Seed length uniformity values of the tested genotypes ranged from 4.0 g to 18.7 g; they were classified into 5 levels.
Seed nutritional properties
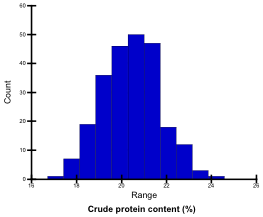
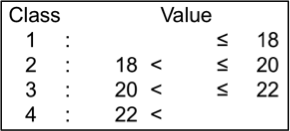
Crude protein content (%)
Grain N content was determined by NC analyzer (Sumigraph NC-22F, Sumika Analysis Center), and the crude protein content was calculated with a nitrogen-to-protein (N:P) conversion factor of 5.45 (Muranaka et al. 2016). Crude protein contents of the tested genotypes ranged from 17.0 % to 24.1%; they were classified into 4 levels.
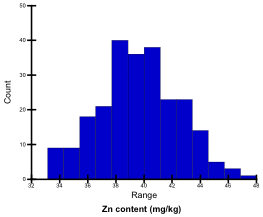
Zn content (mg/kg)
Zn content of ground samples digested with 2 N HCl was determined by atomic absorption spectrometry (Z-5010, Hitachi). Zn contents of the tested genotypes ranged from 33.3 mg/kg to 47.3 mg/kg; they were classified into 5 levels.

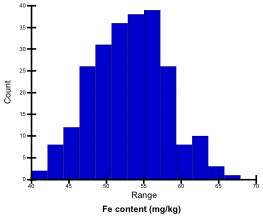
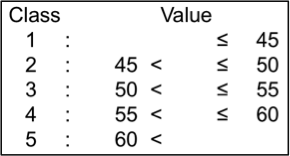
Fe content (mg/kg)
Fe content of ground samples digested with 2 N HCl was determined by atomic absorption spectrometry (Z-5010, Hitachi). Fe contents of the tested genotypes ranged from 41.4 mg/kg to 66.3 mg/kg; they were classified into 5 levels.
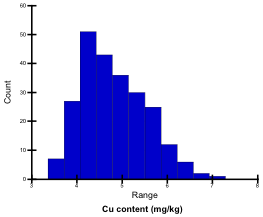
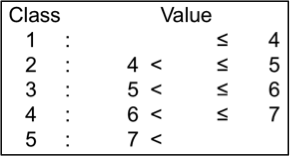
Cu content (mg/kg)
Cu content of ground samples digested with 2 N HCl was determined by atomic absorption spectrometry (Z-5010, Hitachi). Cu contents of the tested genotypes ranged from 3.4 mg/g to 7.3 mg/g; they were classified into 4 levels.
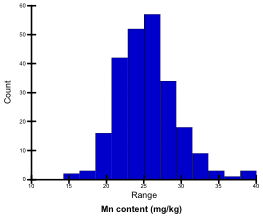
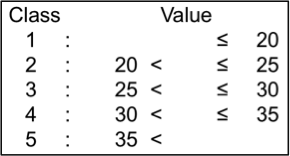
Mn content (mg/kg)
Mn content of ground samples digested with 2 N HCl was determined by atomic absorption spectrometry (Z-5010, Hitachi). Mn contents of the tested genotypes ranged from 14.7 mg/kg to 39.4 mg/kg; they were classified into 5 levels.